If poverty is rare, why do I see it everywhere?
Study on how median income estimation method renders affordable housing programs useless.
An LLM was used in the creation of this post.
Affordable housing programs define their target as households under 80% of the area median income, and they cap the rent at 30% of that limit.
An example with the national figure. The American Community Survey (ACS) reports a median household income of $81,604 for 2024. 80% of that is $65,283. 30% of $65,283 is $19,585 a year, which is $1,632 a month.
What the survey sees
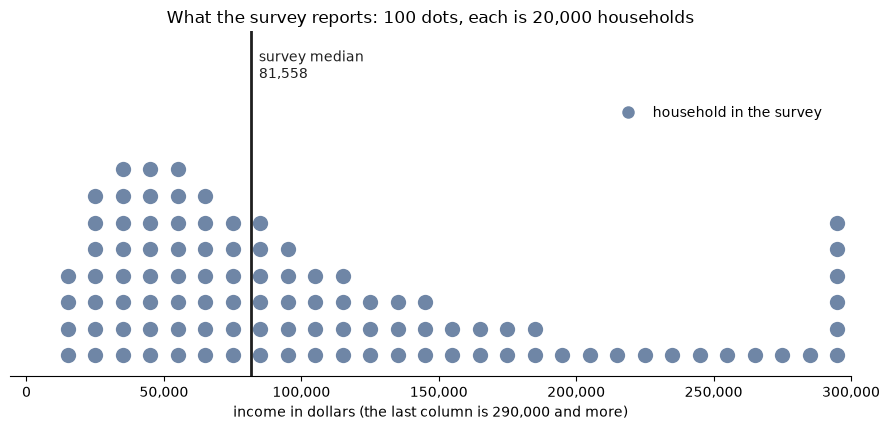
I made a country of 2,000,000 households with the same income distribution as the ACS reports for 2024. The picture shows it as 100 dots. Each dot stands for 20,000 households. The median of the made-up country is $81,558.
Do homeless need housing?
Median household income counts households only. A shelter and a prison are group quarters, not households. A person on the street has no address to sample.
- HUD counted 745,652 homeless people on one night in January 2025.
- The 2020 Census counted 1,967,297 people in correctional facilities for adults.
That is 2 people for every 100 households. I add them as 2 faded dots with an income of zero.
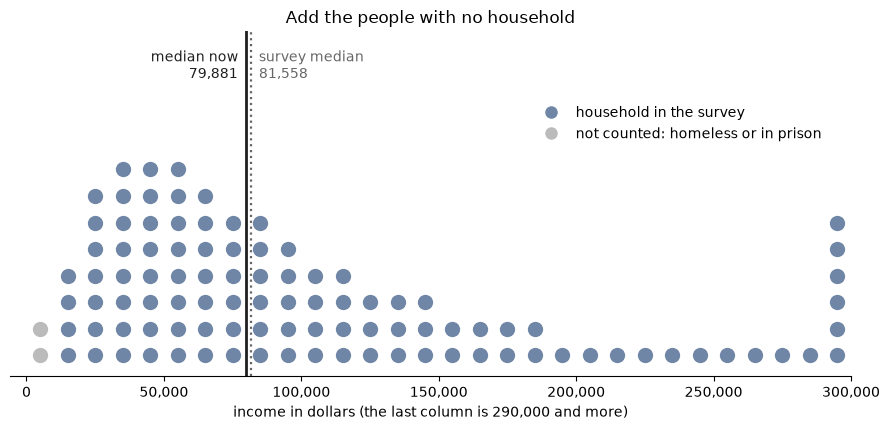
With that adjustment, median household income goes down by $1,677.
This methodological approach is "interesting": the more people from the bottom half are out in the street or in prison, the higher the median household income becomes.
Response bias
The ACS works in two stages. An address first gets letters that ask the household to answer online or by mail. If nobody answers, a field worker may visit, but only a part of the silent addresses gets a visit.
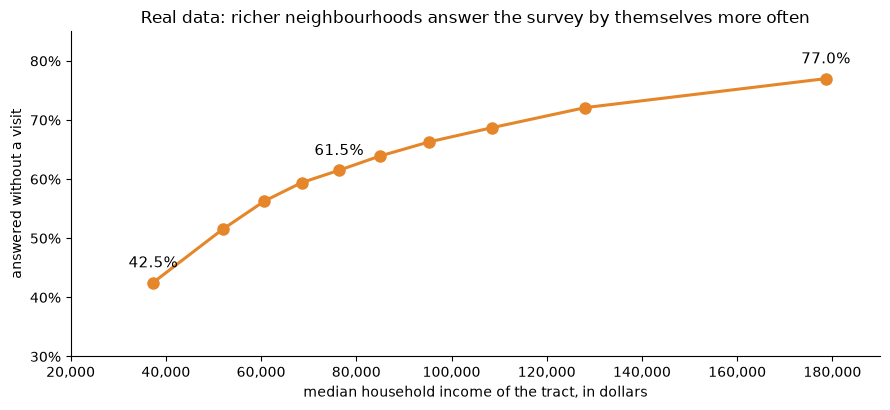
The Census Bureau publishes response and income statistics for the tracts it surveys.
| Tracts | Median household income | Answered without a visit | Poverty rate |
|---|---|---|---|
| Poorest tenth | $37,319 | 42.5% | 31.0% |
| Third tenth | $60,717 | 56.3% | 15.5% |
| Fifth tenth | $76,359 | 61.5% | 11.2% |
| Eighth tenth | $108,489 | 68.7% | 6.9% |
| Richest tenth | $178,597 | 77.0% | 4.3% |
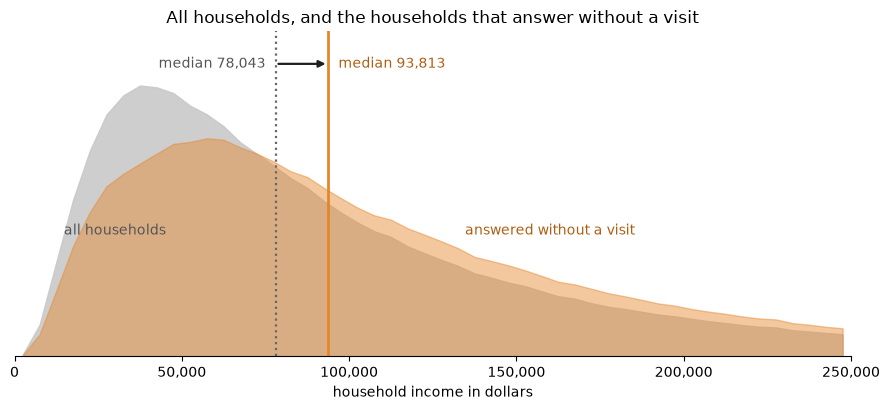
The Census Bureau tries to correct this with the visits. In 2021, 67% of the visits got an answer.
| Follow-up | Survey median is too high by |
|---|---|
| No visits | 22.9% |
| Visits, and 67% of them get an answer | 4.5% |
| Visits, and 50% of them get an answer | 7.5% |
The picture uses the 67% row. The 2 new faded dots are households that the survey missed.
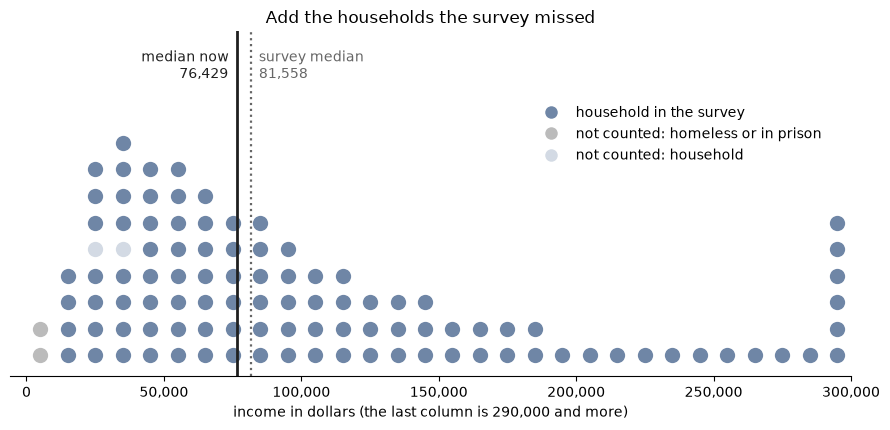
If we account for response bias, the median drops by another $3,452.
What is doubling up?
If you live with your parents (17% of adults aged 25 to 34 did in 2021, up from 8% in 1971) or with friends or roommates, you are one household. Unsurprisingly, those households usually absorb what would be below-median households.
The Census Bureau reported that in 2010, 18.7% of households were shared. If we extract the ones that would be a separate household, we get 1 more household below the median for every 100.
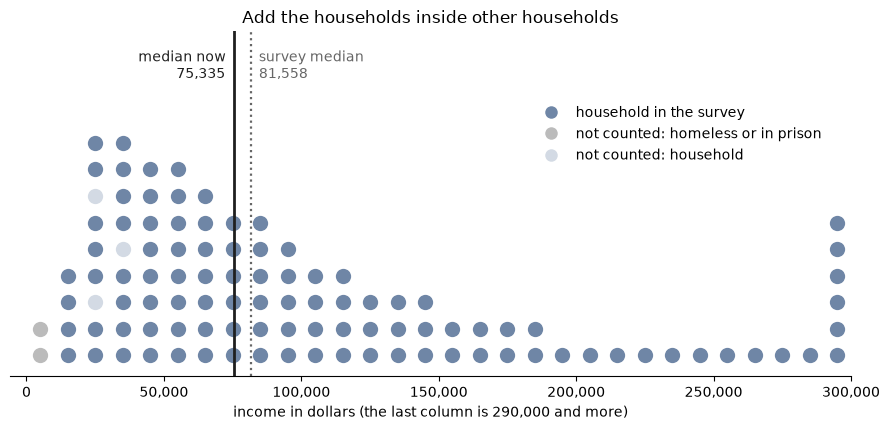
If we account for the would-be households, our median estimate error shifts even further.
The estimate is 3.7 million people who doubled up for lack of money in 2019. That is about 1 of every 100 households.
With doubling up accounted for, the median drops by another $1,094.
By the survey's method, the median household income is $81,558. With three corrections it turns into $75,335.
What this does to a housing program
Assumptions:
- The program admits households under 80% of the survey median, which is $65,246.
- The rent is 30% of that limit, which is $1,631 a month.
- In the pictures, a household can pay the rent if it takes at most 35% of its income. That needs an income of $55,925 or more. The table gives 40% and 50% too.
- The target group is the households under 80% of the corrected median.
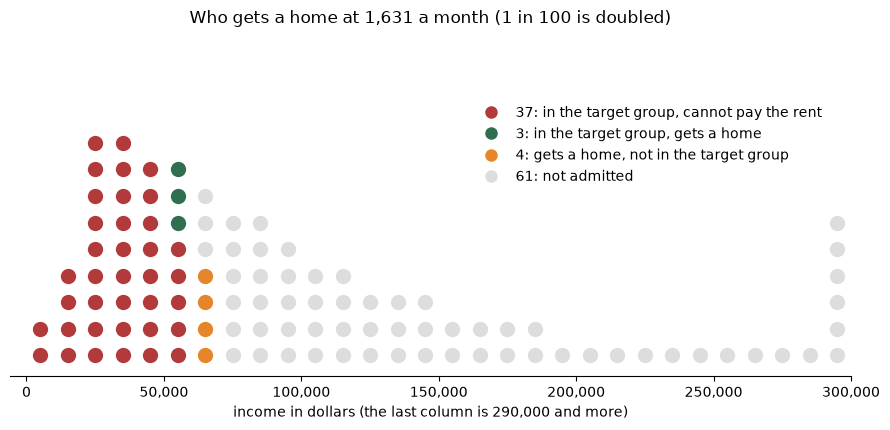
Target households served, of 100:
| The rent takes at most | Income needed | Survey median | Corrected median |
|---|---|---|---|
| 35% of income | $55,925 | 18 | 8 |
| 40% of income (2.5 times the rent) | $48,935 | 32 | 23 |
| 50% of income | $39,148 | 53 | 44 |
Households that get a home and are not in the target group, as a share of all households that get a home:
| The rent takes at most | Survey median | Corrected median |
|---|---|---|
| 35% of income | 0% | 52% |
| 40% of income | 0% | 29% |
| 50% of income | 0% | 17% |
Should median income calculation for affordable rent include home owners?
In the ACS for 2024, 34.7% of households rent. The median was $100,721 for owners and $54,446 for renters.
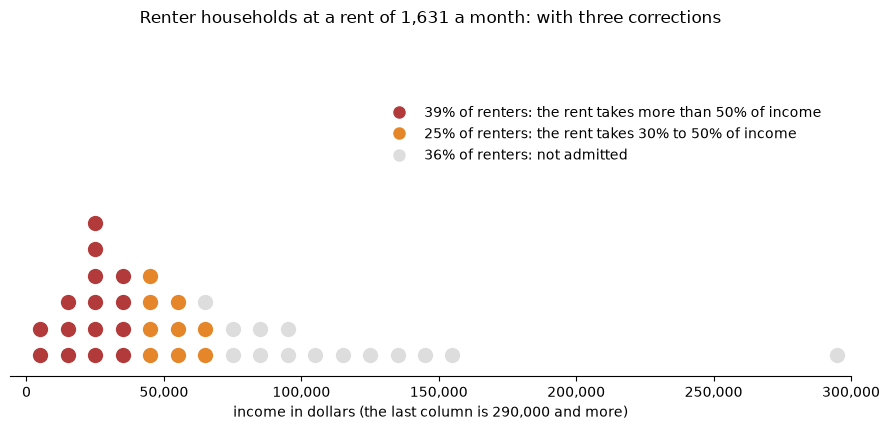
The limit is $65,246 and the rent is $1,631 a month. HUD calls a household cost burdened if housing takes more than 30% of its income, and severely cost burdened above 50%. Of renter households:
- 59% are under the limit. At that rent, each of them is cost burdened.
- 33% are severely cost burdened. That is each renter household with an income under $39,148.
- 41% are not admitted.
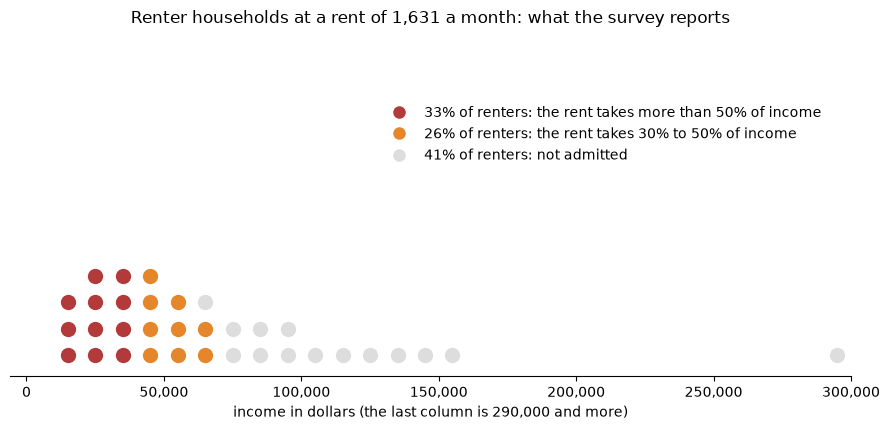
The same three corrections, for renters. We split the added households into renters and owners by income, in the same proportion as the ACS shows at each income level.
| Renters | Median | Rent over 30% of income | Rent over 50% of income | Not admitted |
|---|---|---|---|---|
| Survey | $54,446 | 59.4% | 33.2% | 40.6% |
| and people with no household | $51,491 | 61.7% | 36.9% | 38.3% |
| and households the survey missed | $49,598 | 63.5% | 38.3% | 36.5% |
| and doubled up | $48,881 | 64.2% | 39.1% | 35.8% |
Reproduce it

Section 12 of the notebook is the model used here. The notebook ends with assertions that pin each number in this post.
Sources
American Community Survey 2024, tables B19013, B19025, B25003 and B25119, read through Census Reporter; HUD income limits; 26 U.S.C. § 42 for the 30% rent rule.
Get new posts
New experiments and research notes, delivered by email.
Prefer a feed? Subscribe via RSS.